Metric Grid
Graph-paper data report with filterable charts, funnels and donuts.
Paste into Claude Code, Codex, Cursor or any agent that supports skills.
Needs: Node.js 22+. Optional: local voice (about 1 GB), FFmpeg and Chrome for MP4. No API keys.
Try it live
Open full screen ↗Click through the sample deck: switch the chart, answer the quiz, drag the cards. Press P to hear the narration.
Read https://claude-motion.com/skills/metric-grid/install.md and follow it to install the "metric-grid" skill, then make a first video with it.
Paste into Claude Code, Codex, Cursor or any agent that supports skills.
Use metric-grid to explain tickets.csv: top categories, channels, weekly trend, and what to fix first.
Turn the document I attach into a 60-second 16:9 narrated explainer for [who will watch, e.g. the support team], playing [where, e.g. the monthly ops review]. Use only the facts and numbers in the document. Metric grid style.

One idea per slide, with points appearing one at a time as they're spoken. Animate one chart for the main number. End on a closing slide with one clear next step.

Topic: [your topic] (e.g. support ticket data)
Attach: [your document, notes or data]
Nothing to install: paste this into Claude Motion (Team or Enterprise) or give it to Opus 5.5 for a similar look. The result changes from run to run; the skill gives the same result every time.
More deck styles
Motion Deck →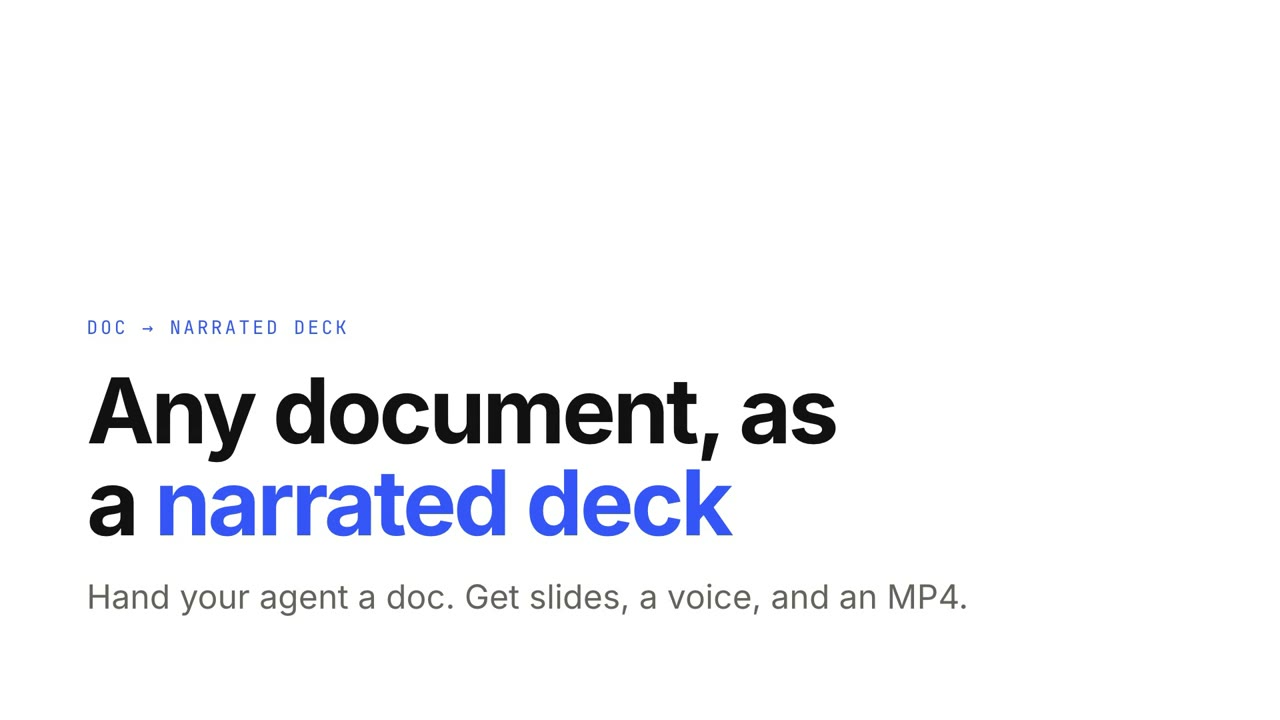
Doc → Narrated Deck
Hand your agent a document; get a narrated, interactive deck and an MP4.
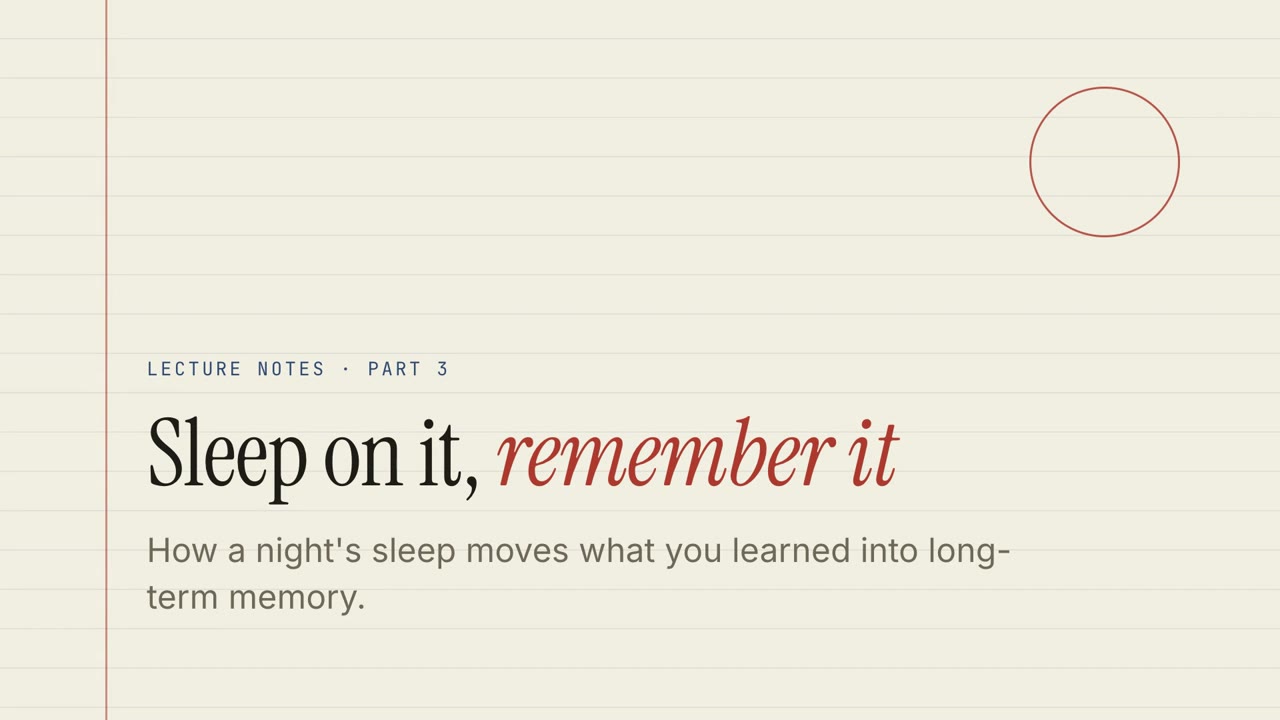
Paper Lecture
Ruled-paper lecture notes with quizzes, drag exercises and a narrated walk-through.

Chalk Classroom
A green chalkboard lesson with hand-lettered headings and practice exercises.
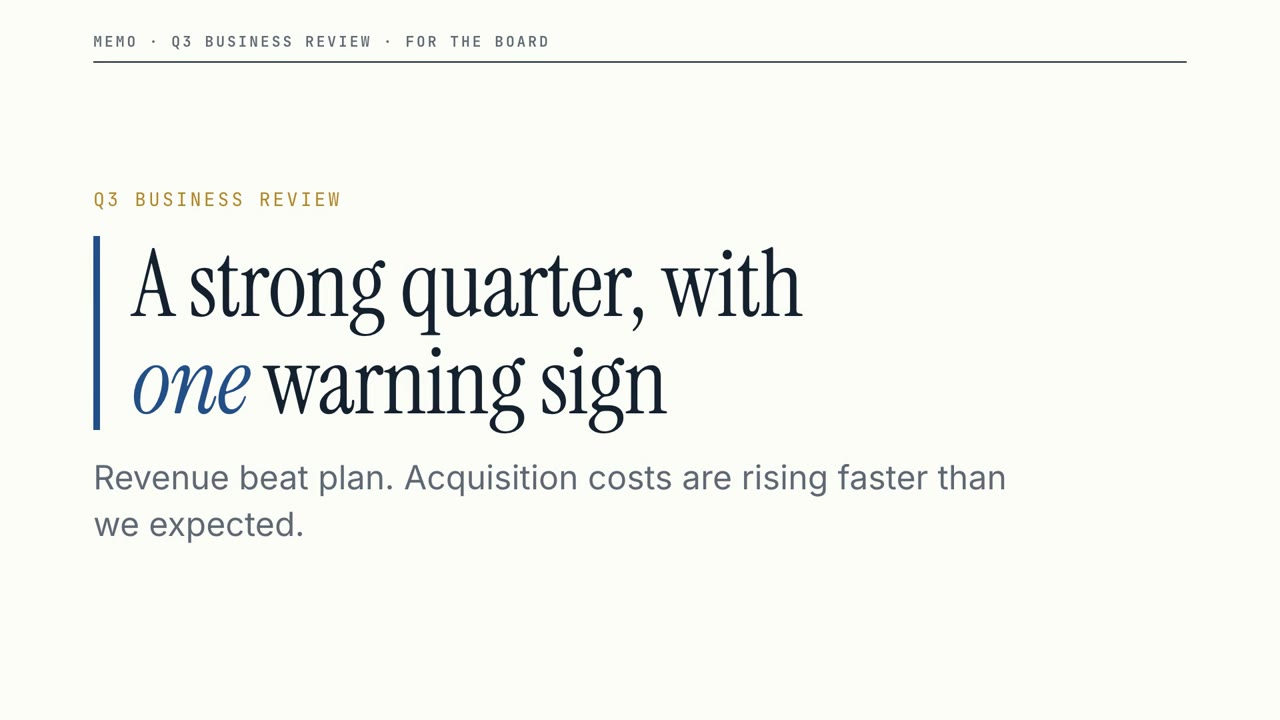
Boardroom Memo
A crisp business review: big numbers, a clear warning, and the decision you need.
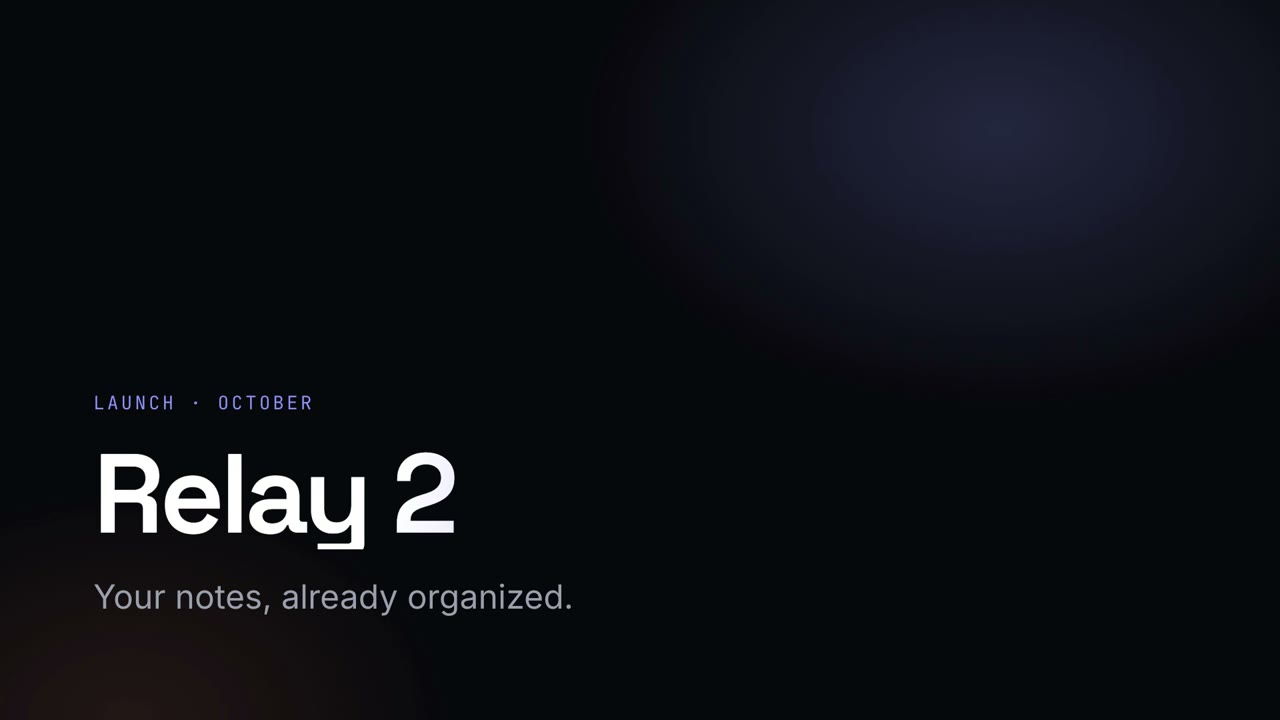
Night Keynote
A dark, glowing launch keynote with gradient headlines.
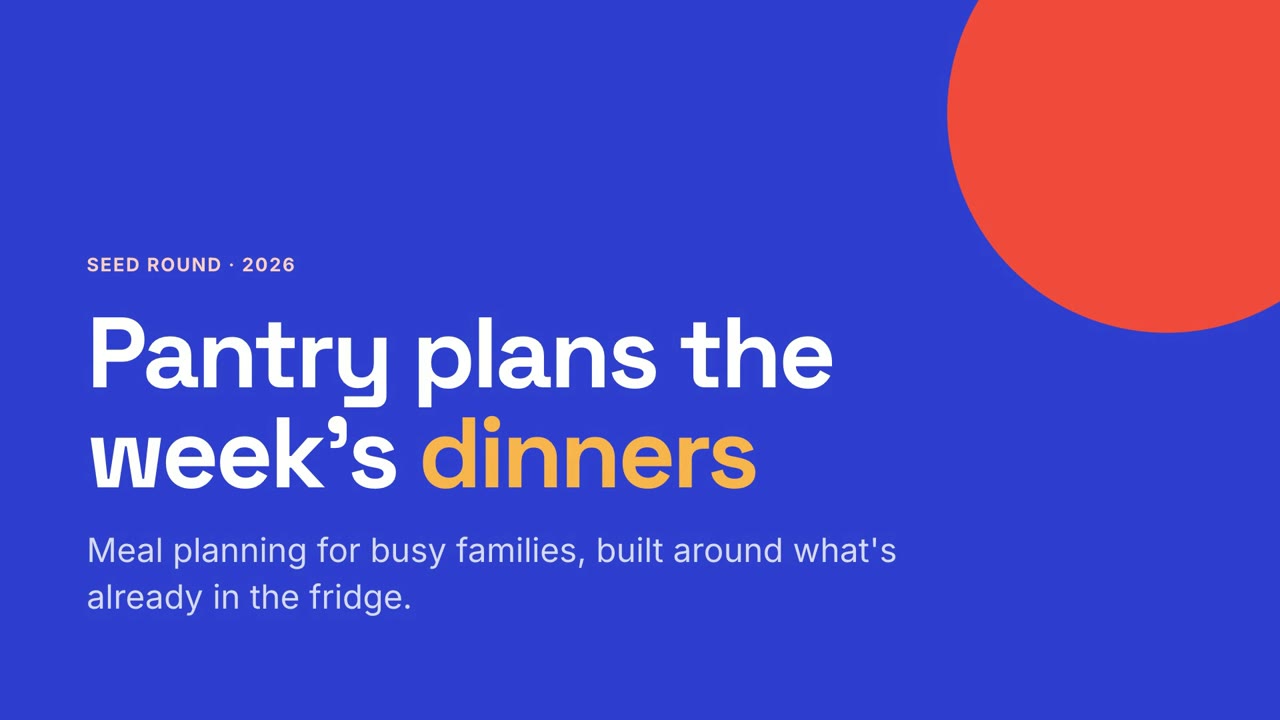
Studio Pitch
A bold startup pitch in cobalt and coral, from problem to ask.
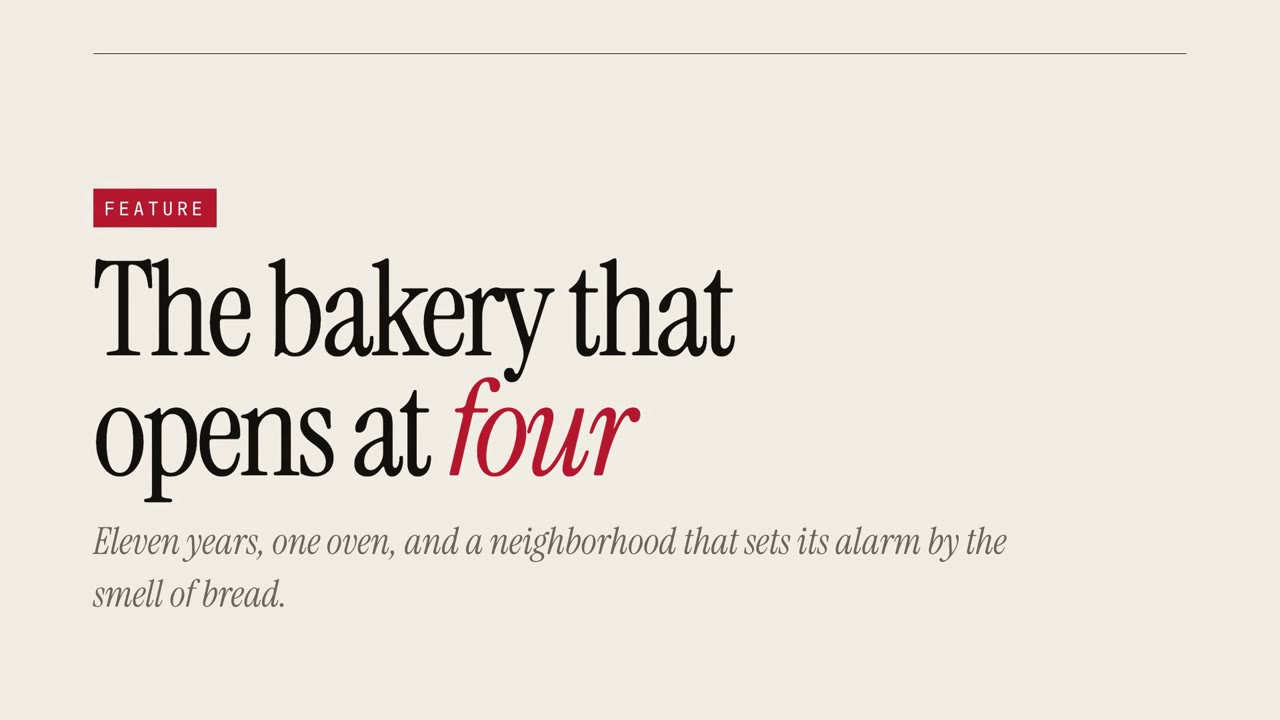
Magazine Story
An editorial feature with oversized serif type and pull quotes.
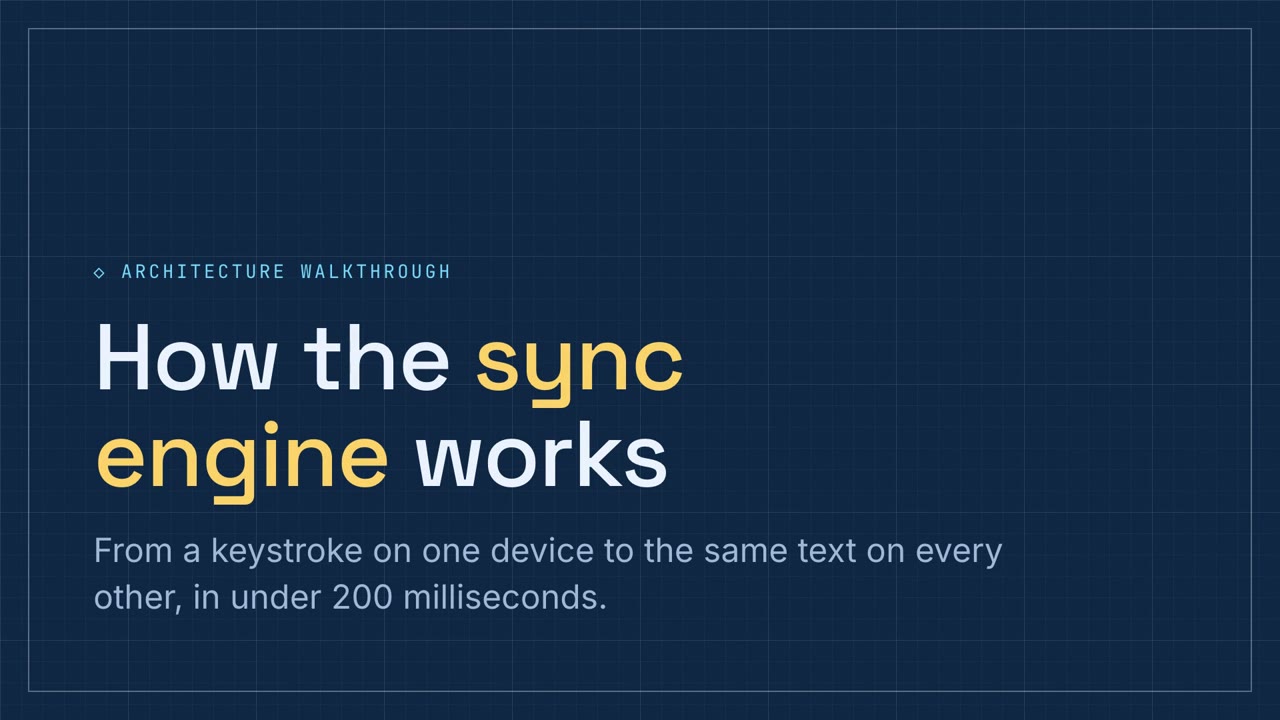
Schematic Walkthrough
A blueprint-blue technical walkthrough with pipeline and component exercises.